Tables


Overview

This section will cover how to typeset tables using the tabular environment.

Why tables?

Tables can be a very efficient way to present information, in fact, we use them often in this tutorial. When writing scientific papers, there are almost always tables of some sort to present data. However, tables can get quite complicated in LaTeX due mostly to assumptions about what the compiler will do with the input. Remember, the compiler will do what you tell it, not what you want!

Our goal in this section is going to be an efficient organization of the following set of data presented here in list form:

We will work up to organizing this information, starting with the basics

The tabular environment

The tabular environment is the basic environment for creating a table. We can think of a table as an array with separate cells where we need to individually define each cell. On the right is the code for a basic table with some of the information above. See how this looks and then we will through each component of it.

View PDF ››

It appears you don't have a PDF plugin for this browser. You can click here to download the PDF file.

x
\documentclass{article}
\begin{document}
\begin{tabular}{l|c}
Name&Salary\\\hline
Mark&$\$250,000$\\
Carly&$\$80,000$\\
Carter&$\$25,000$\\
Sam&$\$50,000$
\end{tabular}
\end{document}
  1. The argument { l | c } represents the number of columns and their justification. Since there are two arguments l and c, there are two columns, the first of which is left-justified and the second of which is center-justified. One can also use an r for right-justified, a p which we will cover below, or a custom justification (the most useful of which is justify on a decimal point). Every column in the table must be declared in this way. The | in the center means put a line in between the two columns.
  2. The ampersand symbol, &, is the horizontal cell delineation. Since this table has two columns, every row must have one ampersand. In general, for an n column table, each row must have n-1 ampersands.
  3. The \\ symbol tells the compiler to the end the current row and start at the left of the next row. Unlike columns, one does not have to predefine the number of rows in the table.
  4. \hline means put a horizontal line under the row that has just been completed.

Remember that one still needs to use math mode inside a table,(\& means print ampersand). It is used in the exact same way as previously covered.

On a stylistic note, refrain from using too many lines in between cells. Due perhaps to the ubiquity of Microsoft excel, people tend to put lines between all of their cells, however the typographical convention, (which is much better looking), is to only use horizontal lines at the beginning of a table to delineate labels from data.

On another note, it is general good to enclose a tabular environment inside a figure or table environment. We will talk more about this next section, but it allows LaTeX to more efficiently place the table in the proper location.

We can now create most basic tables, however, there are a couple of subtleties that need to be discussed for more complicated ones.


Large amounts of data

When dealing with large amounts of data, either in the form of a large table or large amounts of data in an indivdiual cell, one must remember the following

  • LaTeX does not automatically word wrap (end text at edge of a cell and start a new row within the cell.)
  • LaTeX will not automatically fit the table on a page.

Getting around these issues is not difficult and can be dealt with in multiple ways. One cautionary warning is that a table is supposed to be a concise representation of data, problems like these can sometimes occur because one is trying to fit too much data in the table. Remember LaTeX is content driven, one should try to fix problems within content before problems within typesetting.

Word-wrap

First we will tackle the automatic word wrap. Notice the difference between the first and second tables in the code below.

\documentclass{article}
\begin{document}
\begin{table}
\begin{tabular}{c|lll}
Name&Salary&Likes&Children\\\hline
Mark&$\$250,000$&windsurfing and jumping on trampolines&Amy, John, and Ray\\
Carly&$\$80,000$&heavy metal music, Paris, and dancing in the rain&Tyra\\
Carter&$\$25,000$&candy, fast cars that he cannot afford and Ramen&None\\
Sam&$\$50,000$&painting, motorcycles, and Reddit&Kyle and Sam Jr.
\end{tabular}
\end{table}
%%%%%%%%%%%%%%%%%%%%%%%%%%%%
\begin{table}
\begin{tabular}{c|lp{2in}p{1in}}
Name&Salary&Likes&Children\\\hline
Mark&$\$250,000$&windsurfing and jumping on trampolines&Amy, John, and Ray\\
Carly&$\$80,000$&heavy metal music, Paris, and dancing in the rain&Tyra\\
Carter&$\$25,000$&candy, fast cars that he cannot afford and Ramen&None\\
Sam&$\$50,000$&painting, motorcycles, and Reddit&Kyle and Sam Jr.
\end{tabular}
\end{table}
\end{document}


View PDF ››

It appears you don't have a PDF plugin for this browser. You can click here to download the PDF file.

x

Note: % signifies a comment. Anything on a line after this character will be ignored by the compiler

We can see that this first table is not what we want since it overlaps the margins. Since we have not even included all the data we eventually want in the table, we need a way to fix this. We have one solution in the second table (which has the same information) where we force LaTeX to word wrap in individual cells by giving them a fixed width. The syntax for this is to use the justification character p followed by {width} where width is in some unit of length (cm,pt,in,em,etc.) This is a good solution to our problem in this particular case.


Landscape

Sometimes we have too many columns and defining a width would force the columns to be too narrow to be aesthetically pleasing. In this case, we can force the table to appear in landscape mode. There are many ways to do this, relying on several different packages, but one way is given in the code below.

\documentclass{article}
\usepackage{rotating}
\begin{document}
\begin{sidewaystable}
\begin{tabular}{c|lll}
Name&Salary&Likes&Children\\\hline
Mark&$\$250,000$&windsurfing and jumping on trampolines&Amy, John, and Ray\\
Carly&$\$80,000$&heavy metal music, Paris, and dancing in the rain&Tyra\\
Carter&$\$25,000$&candy, fast cars that he cannot afford and Ramen&None\\
Sam&$\$50,000$&painting, motorcycles, and Reddit&Kyle and Sam Jr.
\end{tabular}
\end{sidewaystable}
\end{document}


View PDF ››

It appears you don't have a PDF plugin for this browser. You can click here to download the PDF file.

x

Here we have used the rotating package and enclosed our normal tabular environment in a sidewaystable environment. While for this particular problem, I would probably use word-wrapping, this landscape fix can be useful for larger data sets


multirow and multicolumn

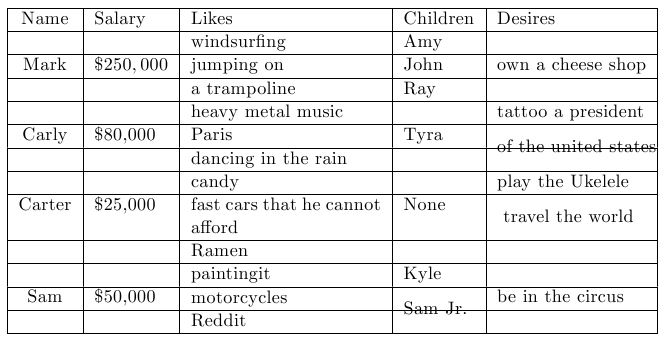
We are now ready to make our full table. In order to do so, we will introduce a nice way to format cells that contain many disparate pieces of data such as several children's names, or several desires. In this case we will be splitting rows into multiple subrows using the multirow package. Try the code below.

\documentclass{article}
\usepackage{multirow}
\begin{document}
\begin{table}
\begin{tabular}{c|lp{1.4in}lp{1.1in}}
Name&Salary&Likes&Children&Desires\\\hline
\multirow{3}{*}{Mark}&\multirow{3}{*}{$\$250,000$}&windsurfing&Amy&\multirow{3}{*}{own
	a cheese shop}\\
~&~&jumping on&John&~\\
~&~&a trampoline&Ray&~\\\hline
\multirow{3}{*}{Carly}&$\multirow{3}{*}{\$80,000}$&heavy metal music&\multirow{3}{*}{Tyra}
&tattoo a president\\
~&~&Paris&~&\multirow{2}{*}{of the united states}\\
~&~&dancing in the rain&~&~\\\hline
\multirow{3}{*}{Carter}&$\multirow{3}{*}{\$25,000}$&candy&\multirow{3}{*}{None}&play the
	Ukelele\\
~&~&fast cars that he cannot afford&~&\multirow{2}{*}{ travel the world}\\
~&~&Ramen&~&~\\\hline
\multirow{3}{*}{Sam}&$\multirow{3}{*}{\$50,000}$&paintingit&Kyle&\multirow{3}{*}{be in the
	circus}\\
~&~&motorcycles&\multirow{2}{*}{Sam Jr.}&~\\
~&~&Reddit&~&~
\end{tabular}
\end{table}
\end{document}


View PDF ››

It appears you don't have a PDF plugin for this browser. You can click here to download the PDF file.

x

Lets look at the first row where in fourth cell, we want to display the fact Mark has three children. To do this, we can effectively split the row up into three subrows. However, there is only one Mark, so we want the name 'Mark' to take up all three subrows.

We use the command \multirow{3}{*}{Mark}. This tells the compiler to have Mark take up all three subrows. Note that for every subrow, we still need to leave a blank space, marked here by ~, where the column would be. In this way we are able to make smaller cells out of larger cells. For illustrative purposes, here is the table split into subwalls.

Tables

We can see that the multi-row allows us to place text in between the sub-rows which is why it is more powerful than using a regular table with more cells.

Warning! Within a multirow environment, the column wrapping will not work with the syntax used in this example.

Remember that tables are finicky. It can take some work to get them looking exactly how you want them, but the end product is worth it. Often one will need to play around with the parameters to get the appearance correct.

I recommend learning how to easily transfer tables from excel to latex. There are several programs one can download that do this however, I prefer to save the table as a .csv file and then use python or some other language of your choice to parse the .csv file and output a latex table. This can save a significant amount of time.


← Back
Table of Contents
Next →

Created by Zachary Glassman. Contact at zach.glassman@gmail.com